Oral Health In Colorado
By the Numbers
Diverse communities call Colorado home.
Across the state, Coloradans talk about how their communities offer connection and support. People identify communication and education as sources of strength. These connections enable people to get information from trusted members in their own community like school staff, faith leaders, resource centers, families and friends. These relationships contribute to the resilience communities demonstrate as they confront barriers to optimal oral health.
The challenges Colorado communities face are as varied as the landscape. Each encounters unique barriers that contribute to state-wide inequities. Factors including insurance status, cost, region, language, and cultural variations impact social determinants of health for people across Colorado.
Coloradans are more likely to have poor oral health if they encounter barriers such as earning low wages, are not covered by insurance, are a racial or ethnic minority, have immigrated recently, have disabilities, or live in a rural community. The following infographics highlight factors that may contribute to oral health disparities
Diverse communities call Colorado home.
Across the state, Coloradans talk about how their communities offer connection and support. People identify communication and education as sources of strength. These connections enable people to get information from trusted members in their own community like school staff, faith leaders, resource centers, families and friends. These relationships contribute to the resilience communities demonstrate as they confront barriers to optimal oral health.
The challenges Colorado communities face are as varied as the landscape. Each encounters unique barriers that contribute to state-wide inequities. Factors including insurance status, cost, region, language, and cultural variations impact social determinants of health for people across Colorado.
Coloradans are more likely to have poor oral health if they encounter barriers such as earning low wages, are not covered by insurance, are a racial or ethnic minority, have immigrated recently, have disabilities, or live in a rural community. The following infographics highlight factors that may contribute to oral health disparities.
REGIONAL DISPARITITES
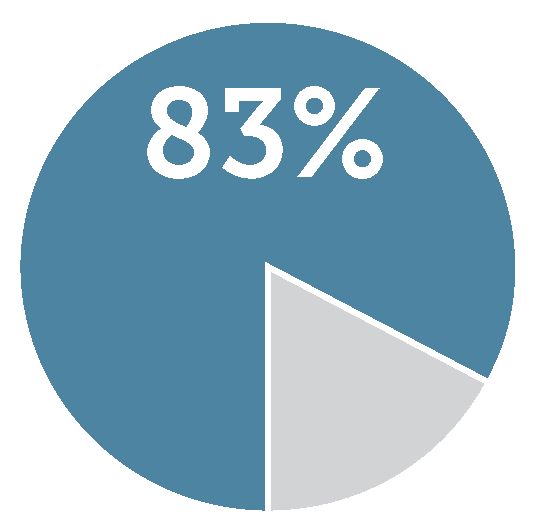
Dental Health Professional Shortage Areas
83% of Colorado’s rural or frontier counties are designated as Dental Health Professional Shortage Areas
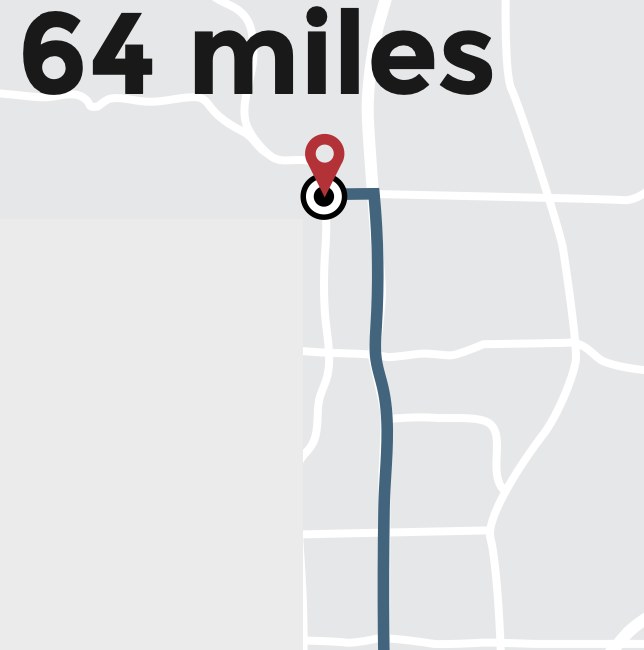
64 Miles For Dental Care
Rural residents with a reliable source of dental care must travel 64 miles for care, on average. (That’s an equivalent distance of travel from Denver to Fort Collins).

Care Shortage
50 out of 64 Colorado counties are designated as either geographic or low- income population Dental Health Professional Shortage Areas (HPSA)
Rural populations have a lower supply of dentists
Oral Health Disparities
Rural populations have a lower supply of dentists, receive less dental care for adults and children, and have higher rates of tooth loss for adults. They are also more likely than urban populations to have inadequately fluoridated drinking water[…] and have lower health literacy.
1 : 1,453
Ratio of dentists to residents in Colorado
Clinical treatment capacity is unevenly distributed across the state of Colorado.
Colorado Oral Health Stats
23
10
6
ECONOMY, RACE AND CULTURE
Social determinants of health (including economic stability, neighborhood and built environment, education access and quality, social and community context, and health care access and quality) are directly related to oral health. Hispanic/Latino community members and those in low-wage earning households experience poorer oral health than their white and higher-income counterparts.
Language Barriers
Though the state is becoming more diverse, the dental profession remains overwhelmingly comprised of White, nonHispanic professionals who often only practice in English.

315,000
Coloradans speak English “less than very well,” which result in additional barriers to navigating insurance and health care.3
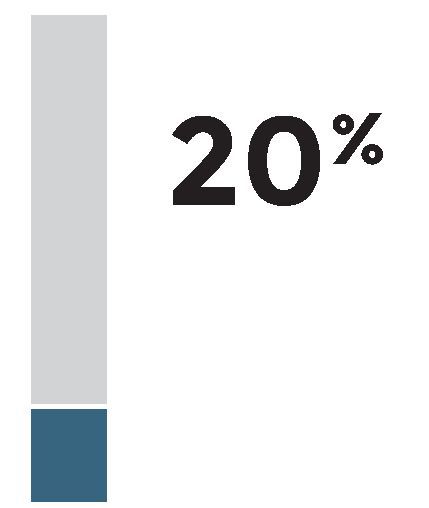
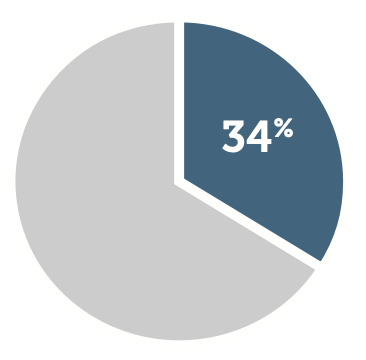
20% Dentists Over 60 Yrs
20% of the dentists with active licenses are over age 60.
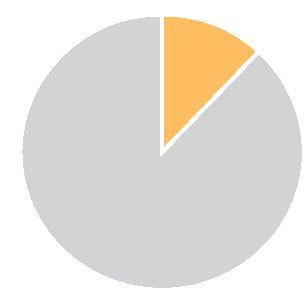
12% of Household Prefer Spanish
12% of Colorado households report Spanish is their preferred language.
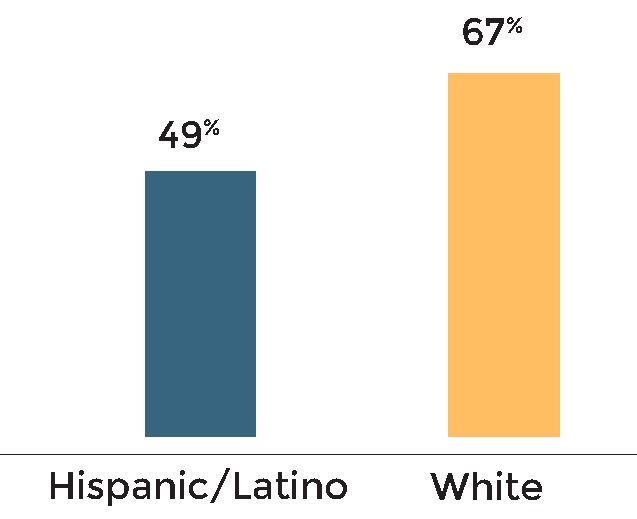
Insurance Status
49% Hispanic/Latino Have Insurance
Treatment is not equally available to all persons because of insurance status or the inability to pay for needed oral health services.
Medicaid Gaps
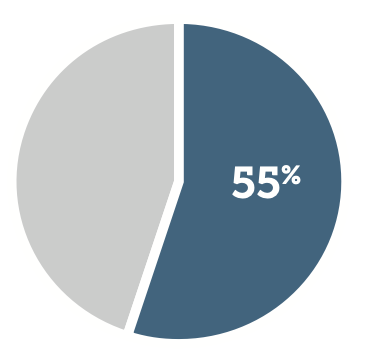
55% Accept Medicaid
Of dentists who accept Medicaid, only 55% had at least one Medicaid claim as a rendering provider.2
34% Hygienists Accept Medicaid Had Claim
And only 34% of hygienists who accept Medicaid had at least one Medicaid claim as a rendering provider.2
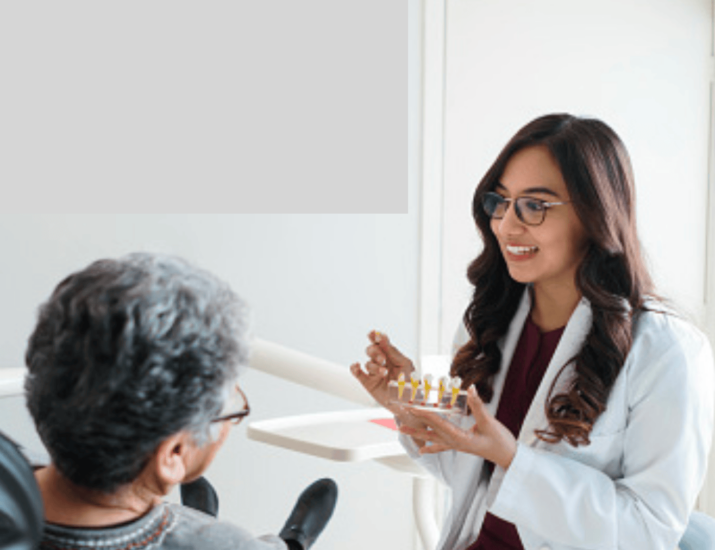
Spanish Speaking Participants
A dentist that speaks their language
Many Coloradans are unable to receive care in a language they are comfortable speaking. Spanish-speaking participants noted that they would prefer seeing a dentist that speaks their language.
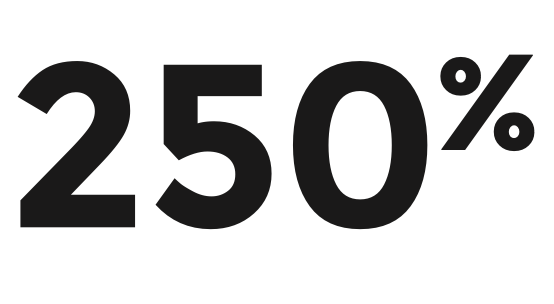
Federal Poverty Level
adults living at or below
Hispanic/Latino adults and adults living at or below 250% of the federal poverty level have statistically similar rates of tooth loss resulting from decay or gum disease.1
ORAL HEALTH AND CHILDREN
The inequities in social determinants of health impact and shape the lives of Colorado’s children and are barriers in accessing oral health care in the state.

Cavities Remain Number One
one chronic disease in children, with potential developmental, economic, and social ramifications.

3 in 10
Children have tooth decay by kindergarten
Childhood Tooth Decay by Ethnicity
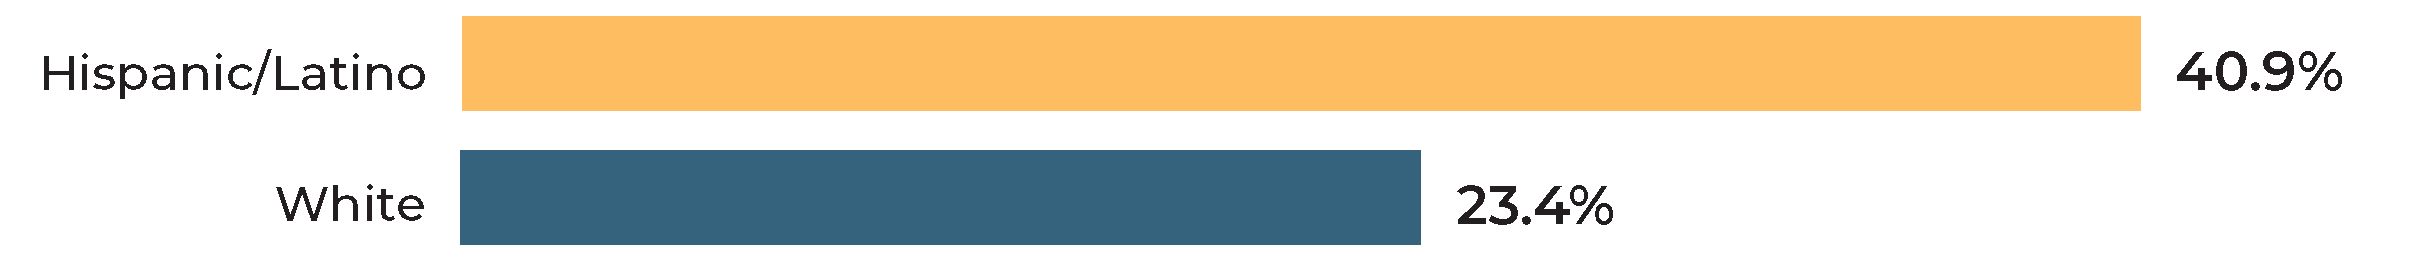
Kindergarten Students
40.9% of Hispanic / Latino and 23.4% of white kindergartners experience tooth decay

Third Grade Students
57.9% of Hispanic / Latino and 37.9% of white kindergartners experience tooth decay
Nearly Half
Nearly half of Colorado children experience a cavity by third grade